Introduction
“When did you first notice the problem?”
This was one of the first questions the cable support rep asked me when I called to report slow Internet speeds.
Like everybody else, I am conducting almost all my activities over the Internet these days. So when I noticed my network speed slowing to a crawl, I immediately did a few diagnostic tasks like rebooting my cable modem. When that didn’t help, I gritted my teeth and called support at Spectrum Cable. After passing through the VRU gauntlet (don’t get me started!) I finally got to a support rep that asked me that question. The problem is, I didn’t really have any idea when my network bandwidth started to deteriorate.
What was worse is that the problem was intermittent so even when I thought it was “fixed” the problem reoccurred. Eventually the problem was resolved by swapping out my ancient cable modem, but I wanted to make sure that I was aware of network problems when they started occurring. I needed to find a way to monitor my network speed on an ongoing basis.
Searching for a solution
First attempt – Raspberry Pi
I quickly found this blog by Simon Hearne https://simonhearne.com/2020/pi-speedtest-influx/ about running speedtest on a Raspberry Pi and capturing the results in InfluxDB. This blog gave me a lot of information on the potential solution, but I had some issues with implementing it.
The first issue is that I only have one Raspberry Pi currently in “production” use, and that use is running pihole. I was concerned about the additional load of running speedtest, InfluxDB, and Grafana on the Pi. But I went ahead and installed the configuration on the Raspberry Pi.
Unfortunately, the bandwidth results I got were significantly lower and inconsistent compared to the results I was seeing from Ookla speedtest on my desktop.
I (incorrectly) hypothesized that the Raspberry Pi didn’t have enough processing capacity but that turned out not to be the cause of the discrepancy.
Finding a new host
I started looking around for another system in my house that was always on and had enough processing power to support the network monitoring. I have a newish Dell laptop I purchased last year dedicated to running family Zoom meetings from my kitchen. The “Zoom” machine is running 64bit Windows 10 Home and has Core I5 processors with 8gb of RAM, so I thought it would be able to handle the monitoring workload.
Since I changed my personal desktop to a Mac four years ago, this would be a good opportunity to brush up on my Windows 10 skills. A quick search showed that InfluxDB, Grafana, and Python were all available for Windows 10.
Speedtest-cli issues
I replicated Simon’s monitoring solution on the Windows 10 machine, but quickly noticed that the network bandwidth had the same slow and inconsistent results I saw on the Raspberry Pi. Doing more digging I found that there are two speedtest command line interface (cli) implementations. The original speedtest-cli had a number of issues reporting reliable network speeds. The newer Ookla version worked much more reliably.
Unfortunately, my Python skills were not up to changing Simon Hearn’s python code to use the Ookla speedtest, so I searched for an alternative.
Speedtest based on Ookla
I found a python solution in this project https://github.com/aidengilmartin/speedtest-to-influxdb by Aiden Gilmartin. It was targeted for Linux, but I felt that I could reuse the InfluxDB and Grafana infrastructure I had already installed on the Windows 10 system. Aiden’s python script speedtest2influx.py had an additional advantage in that it was set up to run continuously at regular intervals.
It took me several days to get these tools running on Windows 10 and I wanted to pass on my learning. A lot of this time was spent re-learning Windows, particularly Windows 10.
Resource for network bandwidth monitoring on Windows 10
Resources needed
A number of different resources and tools are needed to implement network monitoring. Some are specific to Windows, but most are Windows versions of the Linux tools.
| Resources | Description | Location |
| Windows 10 64-bit running on an X86 PC | The target Windows 10 machine should have sufficient power and memory to run the application. | Note: Must be running 64bit Windows 10 |
| Ookla Speedtest CLI | The source for the network data | https://www.speedtest.net/apps/cli |
| Python for Windows | The execution environment | https://www.python.org/downloads/windows/ |
| InfluxDB for Windows | The database to store the data | https://portal.influxdata.com/downloads/ |
| Grafana for Windows | Graphing display | https://grafana.com/grafana/download?platform=windows |
| speedtest-to-influxdb | Aiden Gilmartin’s python code to gather and store the network data | https://github.com/aidengilmartin/speedtest-to-influxdb |
| NSSM | The Non-Sucking Service Manager is used to create a Windows Service to gather the network data | https://nssm.cc/ |
| speedtestservice.bat | Windows bat file to set up environment variables and call the python code to test | https://github.com/phastflyer/speedtestauxiliary |
| speedtest-jay.json | Grafana dashboard | https://github.com/phastflyer/speedtestauxiliary |
References
Everything I have done was built on the work of others. These are some references I used to help me with this project.
| Reference | Description | Location |
| Collecting SpeedTest results in Influx on Raspberry Pi | Simon Hearn’s instructions for how to set up data gathering on a Raspberry Pi | https://simonhearne.com/2020/pi-speedtest-influx/ |
| README.md | Aiden Gilmartin’s instructions to gather and store the network data | https://github.com/aidengilmartin/speedtest-to-influxdb/blob/master/README.md |
| How to get Ookla’s Speedtest CLI on Windows/Ubuntu/macOS? | Joseph Blessingh blog for using the Ookla speedtest cli on Linux, Windows and Mac | https://medium.com/@fruitfuljoseph/how-to-get-ooklas-speedtest-cli-on-windows-ubuntu-macos-146813922cfd |
| Speedtest-cli | Matt Marz original speedtest-cli implementation – now deprecated | https://pypi.org/project/speedtest-cli/2.1.2/ |
| How to install InfluxDB on Windows 10 | Schkn’s instructions on InfluxDB on Windows 10 including how to use NSSM to run InfluxDB as a service | https://devconnected.com/how-to-install-influxdb-on-windows-in-2019/ |
| Install (Grafana) on Windows | Grafana guide to Windows 10 | https://grafana.com/docs/grafana/latest/installation/windows/ |
Step by step Instructions
Make sure you are running installation programs as an administrator
One thing I learned is that most of the installation tasks should be run as administrator.
Many of the problems I ran into were the result of using just my Admin id to install the applications needed for this project.
Some of the installation programs will default to install only for the local user, which can cause issues later when trying to run things as a service.
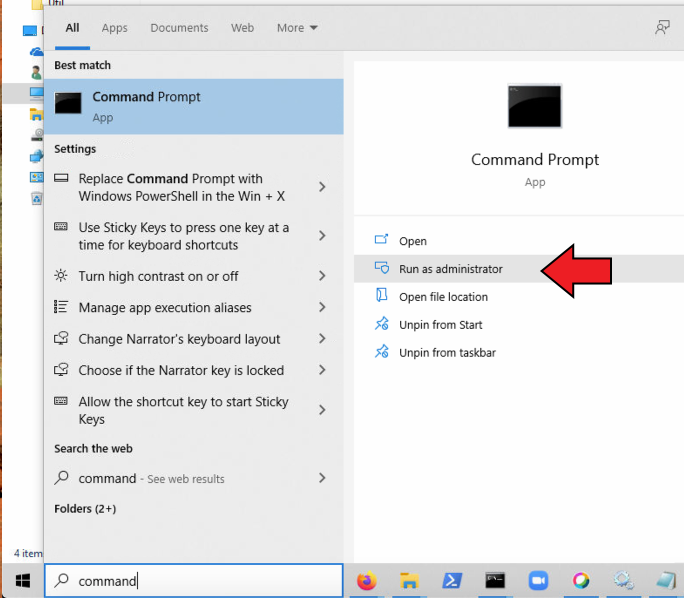
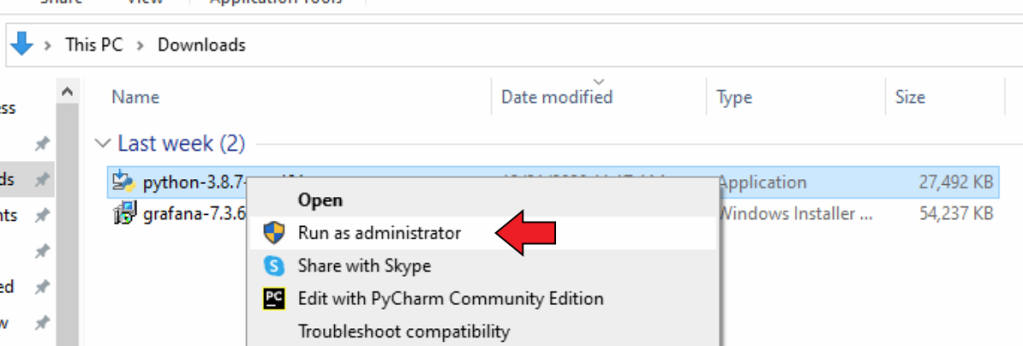
So always run installation programs as administrator – either by running in a Command window or PowerShell as administrator or by running the installation program from your Download directory.
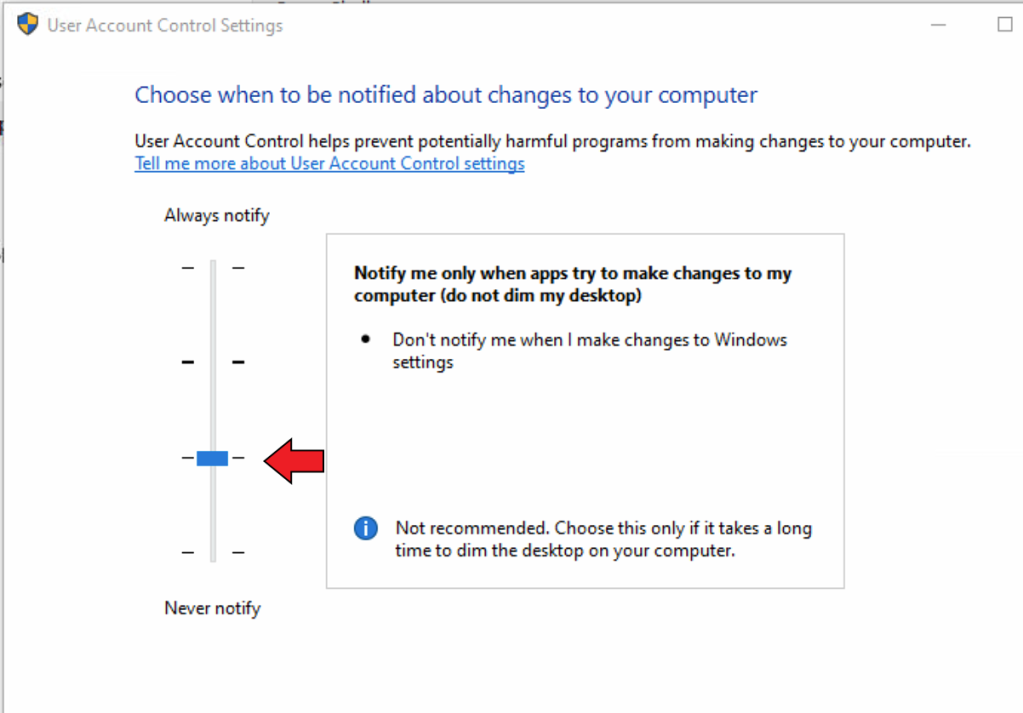
I also set my User Access Control to the lowest level that still notified me about potential changes.
Installing Speedtest CLI
Since the data provided by the Ookla Speedtest is the core of this application, we can start there. Rather than install the standard GUI speedtest, we are going to install the Ookla Speedtest CLI (Command Line Interface).
Browse https://www.speedtest.net/apps/cli and select the Windows download.
Select the Open with Windows Explorer to automatically unzip the archive file.
A Windows Explorer window will open with two files, speedtest.exe and speedtest.md.
Copy the speedtest.exe file to someplace in your %PATH%
Start up a command window and test speedtest cli
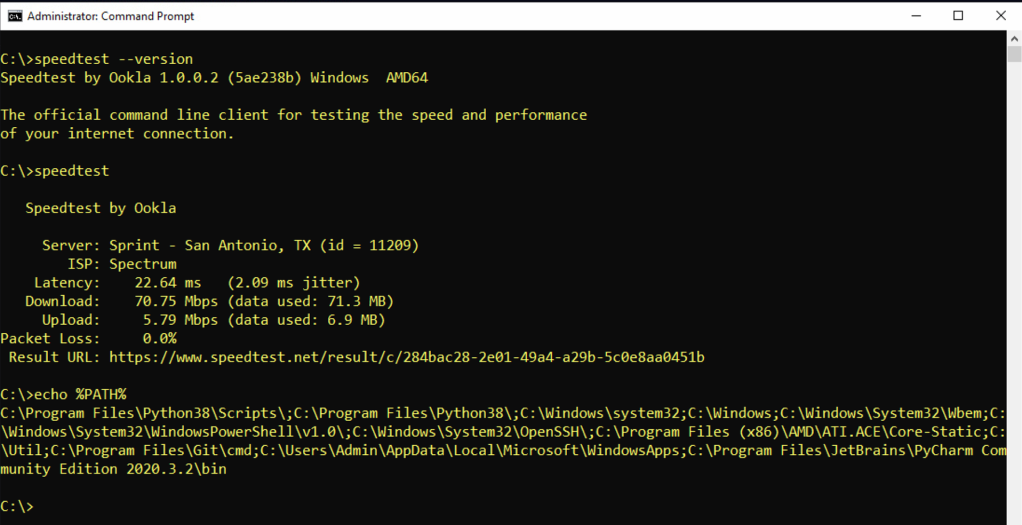
If you can’t find speedtest, then the directory you copied it to is not in your %PATH%
Installing Python
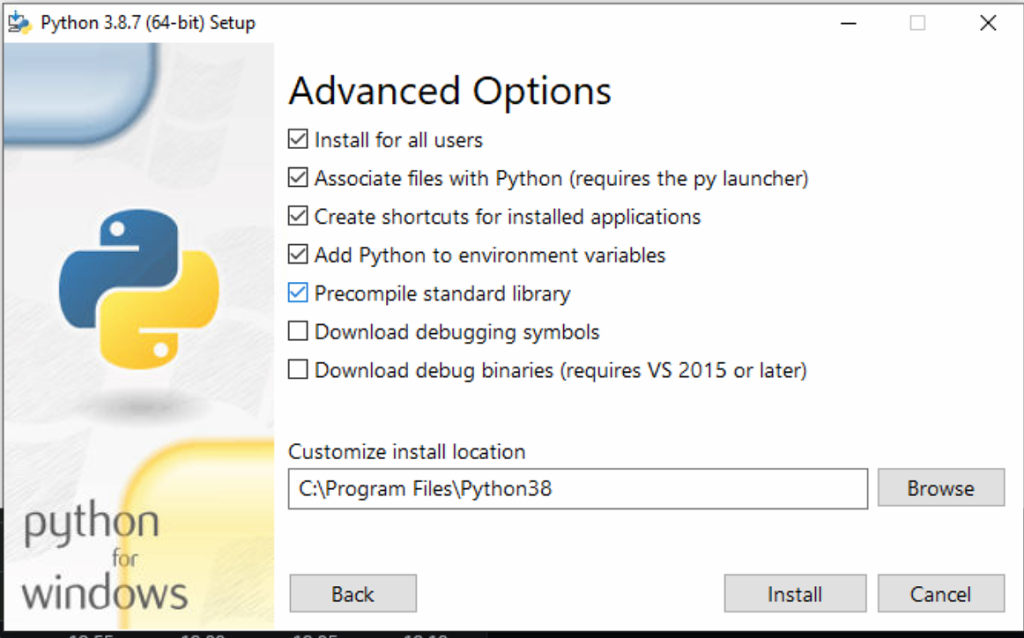
I chose to install Python from https://www.python.org/downloads/windows/ but you could also use the Microsoft App store. Either way works. I chose the 64bit version. Just make sure you are installing for all users on the system and to add Python to environment variables.
You can start the Python installation from your Download location. Make sure you run the installer as an administrator

Make sure that you check the Install for All users and Add Python to environment variables options.
Be sure to enable the pip feature.
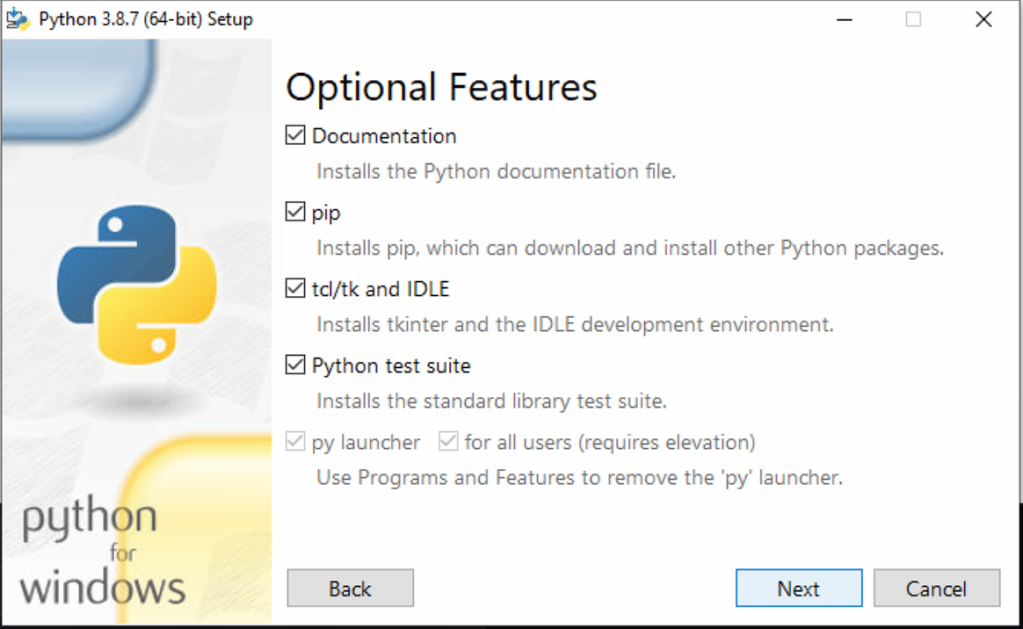
After a few moments, Python should be installed.
Start up a command window ensuring that you start it with administrator privileges and enter:
cd “\Program Files\Python38
pip install influxdb
pip show influxdb
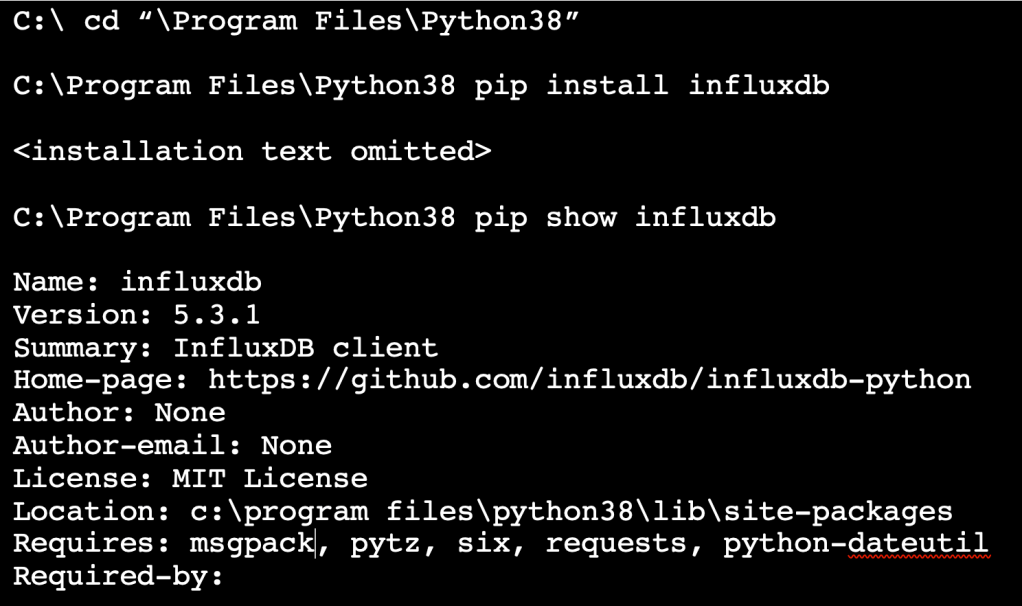
Notice the Location: is pointing to the location where the InfluxDB package was installed. You will need that information for the next step.
Next, we are going to add the search path for Python packages to the system environment variables.
Navigate to the Windows Control Panel -> System and Security -> Systems -> Advanced Settings
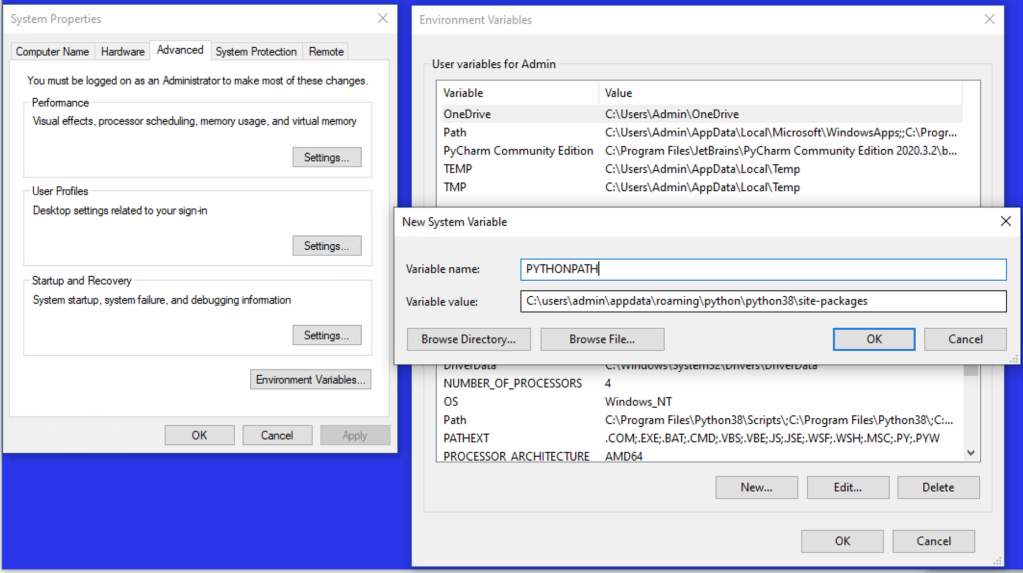
Add PYTHONPATH as a System variable and point it to the location where the InfluxDB was installed in the previous step. This ensures that all Python programs running as a service can find the InfluxDB package.
Reboot after the installation to ensure the system variables are set to include the Python executables. You are now finished installing Python
Installing InfluxDB
InfluxDB is used to store the values gathered by the speedtest cli. The process for installing InfluxDB described here https://devconnected.com/how-to-install-influxdb-on-windows-in-2019/ was pretty easy to follow. I just needed to make some tweaks to make it ready for recording speedtest results.
The first step is to go to the InfluxDB download site and select the 1.8X version.
(At the time I write this, the 2.X version did not have Windows binaries)
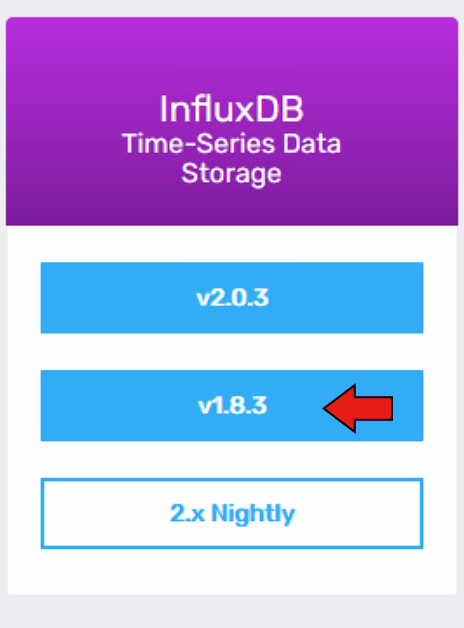
You will see a list of archives to download. Select the Windows 64-bit version.

Click to download and select Open with Explorer. This will open an Explorer window with the unarchived files in a folder

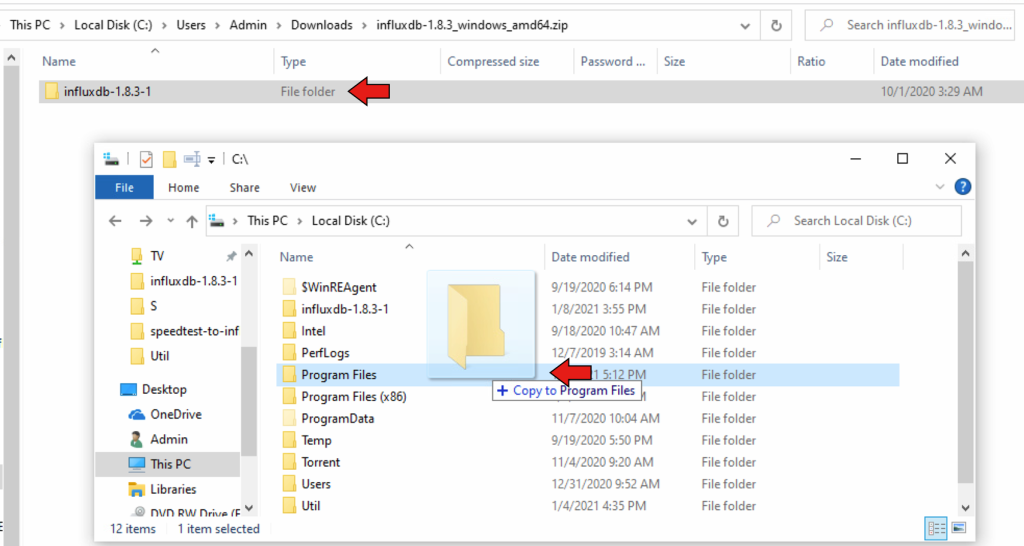
Next, we are going to copy the InfluxDB files to the location it will run from in the C:\Program Files directory
Start a second Explorer window and open to your C:\ drive
Drag the unarchived folder from the Download folder to the C:\Program Files directory
Configuring InfluxDB
Now we are going to get InfluxDB ready to run.
Double click on Program Files folder to open it, then double click on the Influxdb folder to open that folder.
You need to create three subdirectories in the InfluxDB folder: data, meta, and wal.
Then create a copy of the influxdb.conf file to something like influx.db.conf.orig for backup.
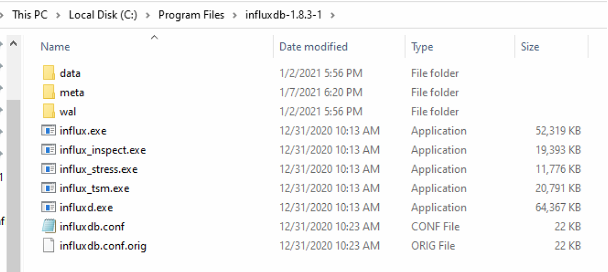
Open the influx.db.conf file with Notepad.
Add [meta] dir, [data] dir, and wal-dir to point to the directories on your system.
NOTE: the quotes and double slashes “\\” are important.
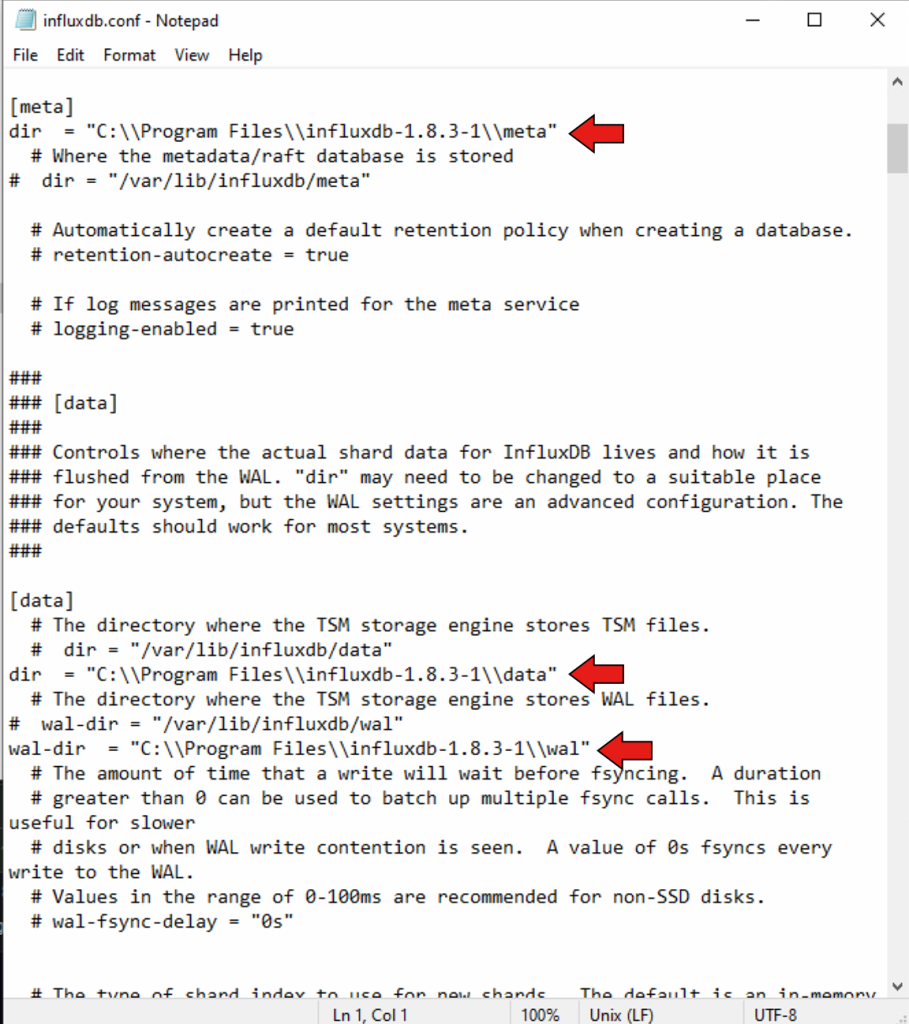
Save and exit the configuration file.
Testing InfluxDB
Now let’s test InfluxDB before we configure it as a service.
Start up a command window as before with Administrator privileges and change to the directory we were just working with then run influxd.exe.
Accept any warnings from the Windows firewall.

Now start up a second command window with administrator privileges and enter
curl -sl -I http://127.0.0.1:8086/ping
If you receive a “204 No Content” message then InfluxDB is working.

Adding InfluxDB database and user
Continue working in the second window where you just ran curl
Note: It is important to enclose the password string in single quotes (‘)
cd “C:\program files\influxdb-1.8.3-1”
influx
>create database speedtest_db
>use speedtest_db
>create user grafana with password ‘<insert a password>’ with all privileges
>grant all privileges on speedtest_db to grafana
>show users
>exit
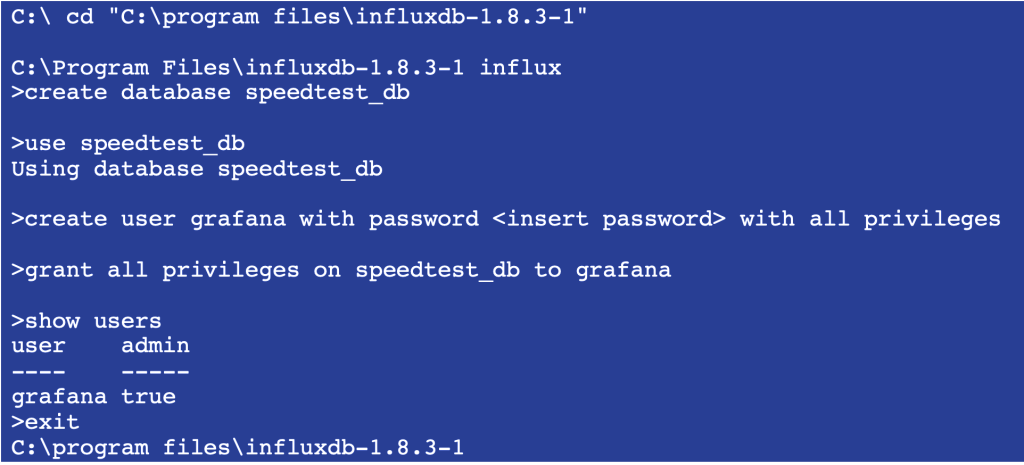
Go to the first command window where you started influxd.exe and close the window to shut down InfluxDB.
Set up InfluxDB as a Windows Service
To run InfluxDB as a service you will need another program: NSSM (Non-Sucking Service Manager). This tool makes it easy to set up any program as a Windows service so that it will be automatically restarted with the system.
Go to https://nssm.cc/download and download the latest stable version. Use the Open in Windows Explorer option to automatically unpack the zip file.
Once the zip file is unpacked, double-click on the nssm directory and then the win64 directory to get to the nssm.exe file.
Copy that file into a directory in your %PATH%
Go to a command line window and enter:
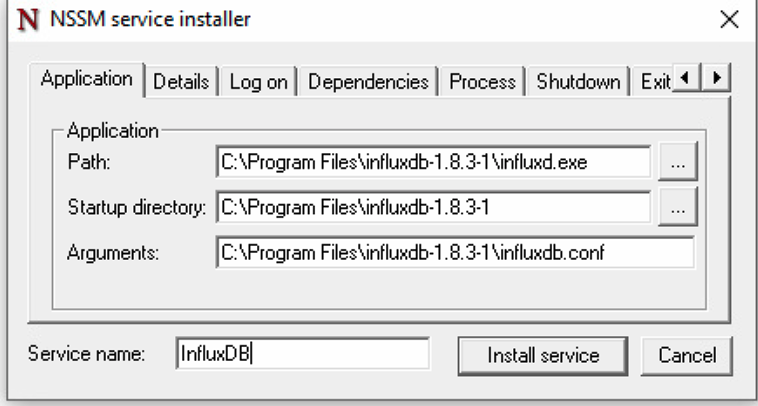
nssm install InfluxDB
Under the Application tab, you set up the parameters for the location where you installed InfluxDB.
Then click on the “Install Service” button
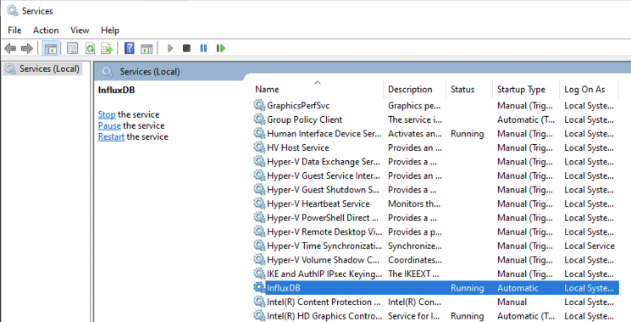
Now go to the Windows Services application to verify InfluxDB is installed as a service.
Start the InfluxDB service. The service will automatically start on reboot.
Run the curl command to verify that InfluxDB is running correctly.
curl -sl -I http://127.0.0.1:8086/ping
If you receive a “204 No Content” message then InfluxDB is working.
Installing the data gathering python script and other files
Set up a directory to hold the python and other files you will need, such as c:\Speedtestservice
mkdir c:\Speedtestservice
Getting speedtest2influx.py
First get the Aiden Gilmartin’s python script speedtest2influx.py from GitHub. There are lots of ways to download GitHub projects but we are just going to use the easiest method to pull a single file
Open your browser to https://github.com/aidengilmartin/speedtest-to-influxdb/blob/master/speedtest2influx.py
You should see Aiden’s python script speedtest2influx.py
Right click on the Raw button and select Save Link as…
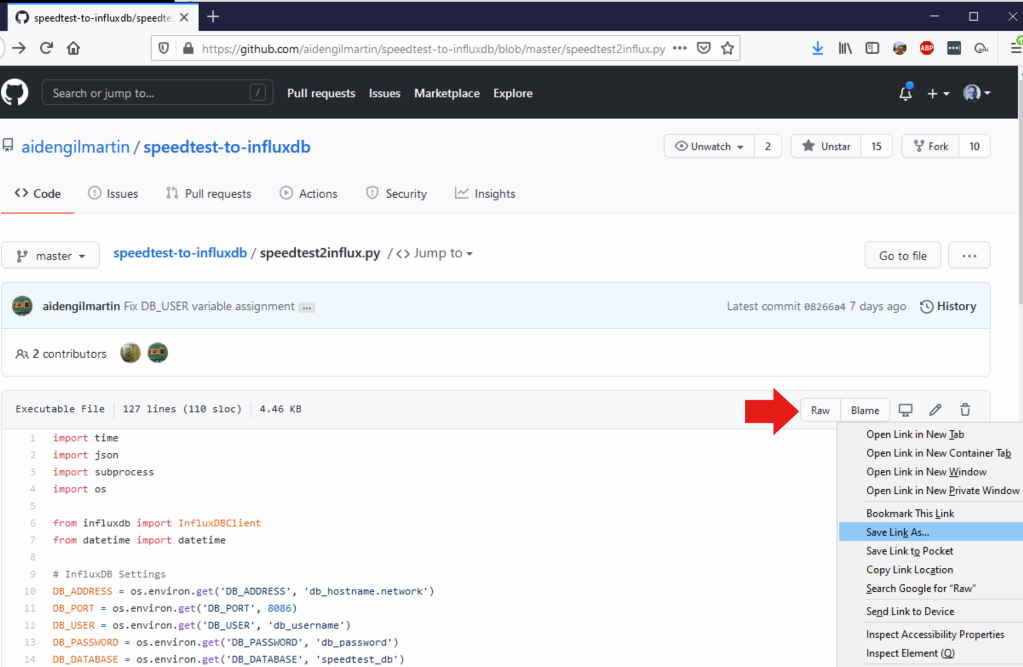
And save to the directory C:\Speedtestservice

Note: Different browsers have somewhat different save dialogs, but the end goal is to save the file speedtest2influx.py and get it into the directory you will run it from.
Getting speedtestservice.bat and Speedtest-jay.json
Now we will download a bat file that we will use to test the speedtest service and a json file that is the grafana console. We will get these from my GitHub repository.
Follow the previous process to download these two files into your C:\Speedtestservice directory
Open https://github.com/phastflyer/speedtestauxiliary/blob/main/speedtestservice.bat in your browser
Note: When you save the speedtestservice.bat file, be sure to change the Save as type: to All files (‘*’).
If you don’t, the file will be saved as “speedtestservice.bat.txt” and you will have to manually rename it to “speedtestservice.bat”
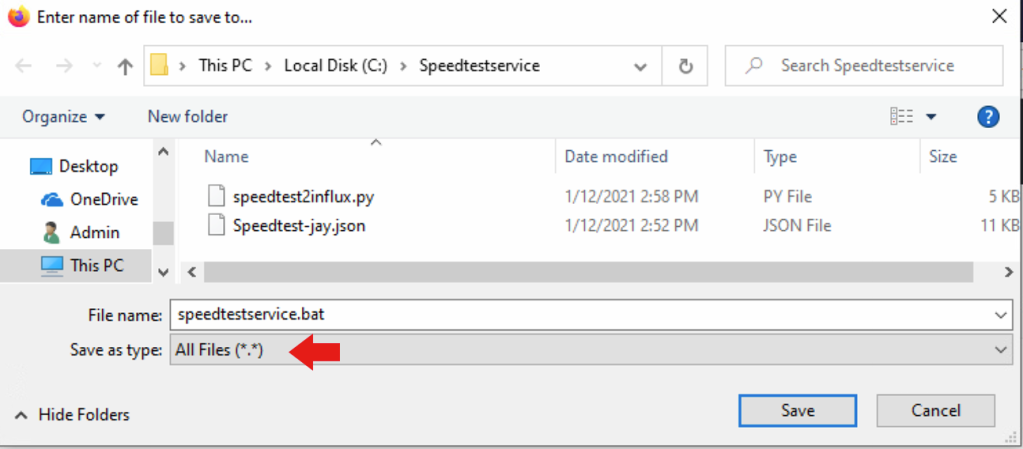
Now download the grafana desktop you will use later
https://github.com/phastflyer/speedtestauxiliary/blob/main/Speedtest-jay.json
Open a command window and cd c:\Speedtestservice
Then start Notepad to edit the bat file
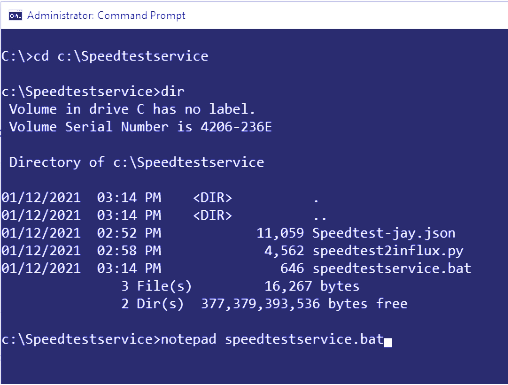
You need to edit two things in the bat file: the influx password DB_PASSWORD you set earlier during the installation of InfluxDB and the PYTHONPATH variable you also set earlier.
Ideally the PYTHONPATH would be obtained from the system variable you set earlier. I had several cases where the PYTHONPATH was not set when running as a service, so included it in the .bat file as insurance.
The TEST_INTERVAL variable sets the amount of time in seconds between speedtest measurements.
I am currently using 900 seconds = 15 minutes since I have been having trouble with my internet speeds. For most people, 1800 seconds/30 minutes is probably good enough. Do not set the TEST_INTERVAL to a value below 900 seconds because Ookla may block you. Remember that Ookla provides these measurements as a free service – don’t abuse it.
The PRINT_DATA=TRUE will record the speedtest results in a service log we will discuss later.
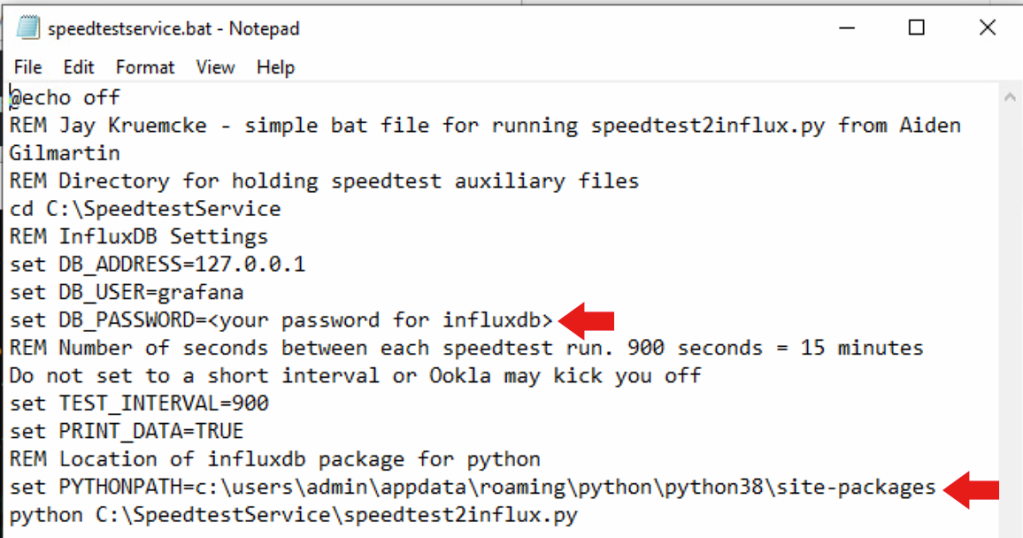
Save the file.
Now let’s test the batch file.
Open a command window and CD to the c:\Speedtestservice directory
Run the speedtestservice.bat
If you see Speedtest successful and Data written to DB successfully the testing was successful.
The speedtest will run every 15 minutes until you cancel it. Since we are only using the .bat file to test, you should terminate once you see the test has completed successfully.
Enter CTRL+C to cancel the batch execution.

Creating the speedtestservice Windows service
To ensure that the speedtest is automatically restarted when the system is restarted, we will use the NSSM tool to set up the python file speedtest2influx.py to run as a service.
As before, go to a command line window and enter
nssm install Speedtestservice
You will be putting information into multiple tabs in the NSSM gui.
Under the Application tab, you set up the parameters for the application to be run.
Path: C:\Program Files\Python38\python.exe Location of python
Startup Directory: :\SpeedtestService
Arguments: C:\SpeedtestService\speedtest2influx.py The application
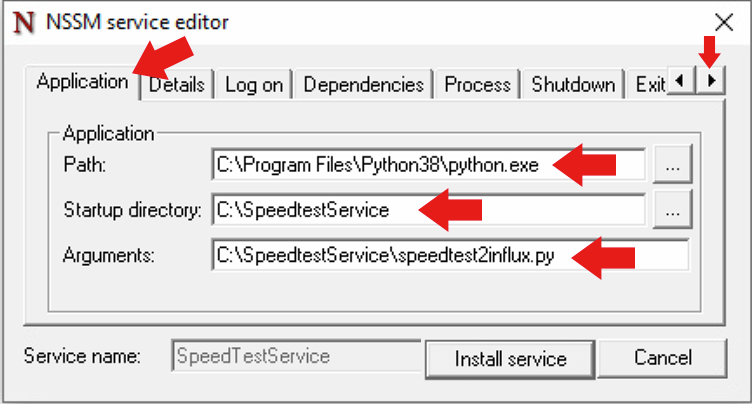
Now press the right arrow button at the top left to go to the Details tab and set up some info that describes what this service does.
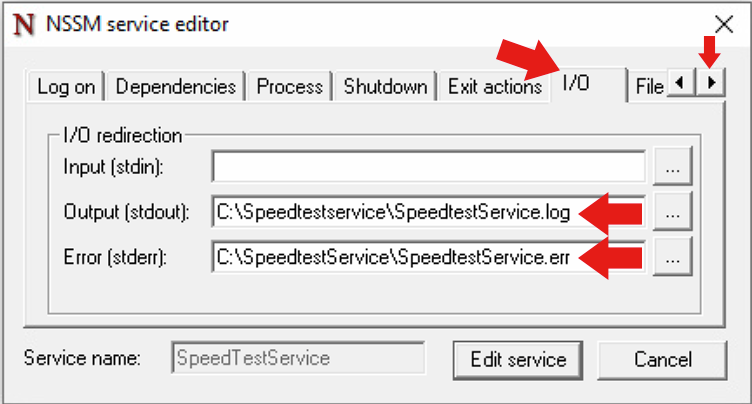
Press the right arrow button again and go to the I/O tab and set the log locations.
Output (stdout): C:\SpeedtestService\SpeedtestService.log
Error (stderr): C:\SpeedtestService\SpeedtestService.err
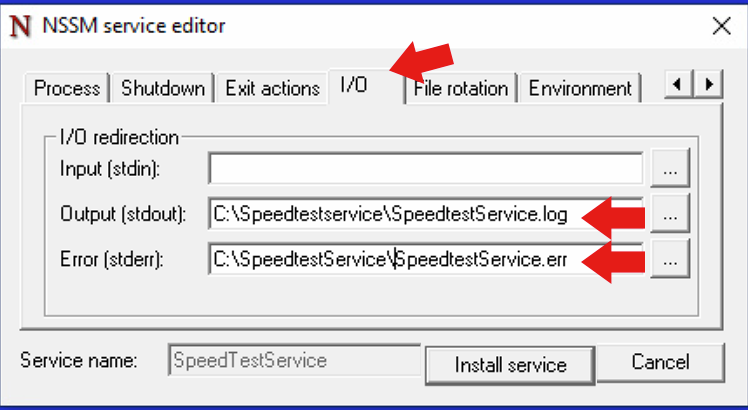
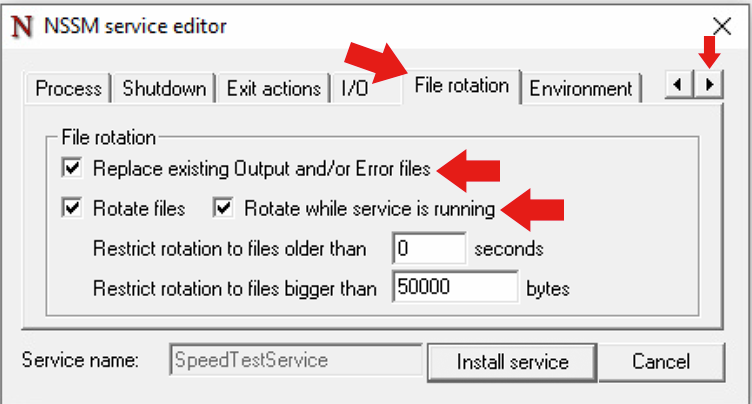
Press the right arrow button again and go to the File Rotation tab.
I wanted to make sure that I got period log files for the service, and that logs were rotated periodically.
Press the right arrow button once more and go to the Environment tab.
This is where you will set all the environmental variables needed for the application.
There are more variables than will fit in the window; don’t omit any!
DB_ADDRESS=127.0.0.1
DB_USER=grafana
DB_PASSWORD=<put your password for influxdb here>
TEST_INTERVAL=900
PRINT_DATA=TRUE
PYTHONPATH=c:\users\admin\appdata\roaming\python\python38\site-packages
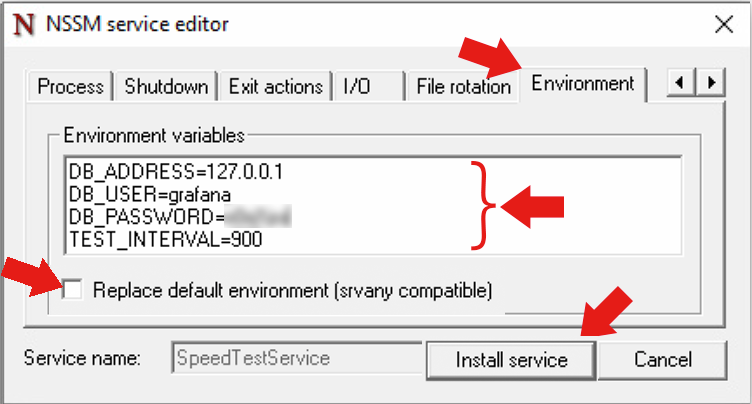
Finally click on the Install service button. You have used NSSW to install speedtest as a Windows service.
Open the Services application in Windows. You should see the Speedtestservice enabled, but not running.
Click Start to start the Speedtestservice service

You should see the service start and move to “Running” state. If you see it stop or say “Paused”, you have a problem. Use the log files in the C:\Speedtestservice folder to diagnose the problem. The two problems I saw were problems opening the InfluxDB package in python (PYTHONPATH should fix this) and an invalid user/password for InfluxDB.
Assuming the service is started and running, you are now automatically collecting the speedtest results every 15 minutes and storing the data into the InfluxDB database speedtest_db .
The final step is to install and configure grafana to display the data.
Installing Grafana
Grafana will be used to provide a graphical chart of the metrics gathered by speedtest. Grafana Labs provides an easy Windows installer. The page https://grafana.com/docs/grafana/latest/installation/windows/ fully explains the installation process.
Go to https://grafana.com/docs/grafana/latest/installation/windows/ and click Download the installer. Select the option Save File.
Then open your Downloads directory in Windows Explorer and double click to install Grafana.

Take the defaults on the graphical installer. Grafana should be installed as a service automatically.
Now, login to Grafana
Open your web browser and go tohttp://127.0.01:3000/ . This is the default HTTP port that Grafana listens to.
On the login page, enter admin for username and password.
Once logged in, you will see a prompt to change the password.
Click OK on the prompt, then change your password.
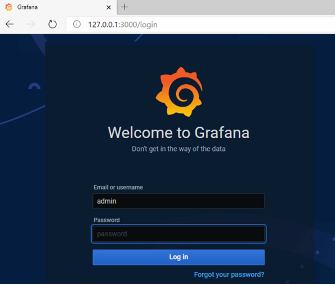
You should now see the default Grafana view
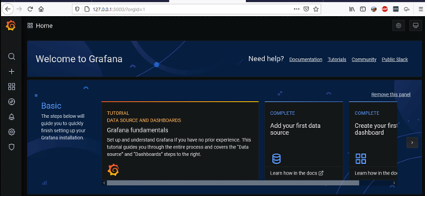
Click on Add your first data source.
Select InfluxDB.
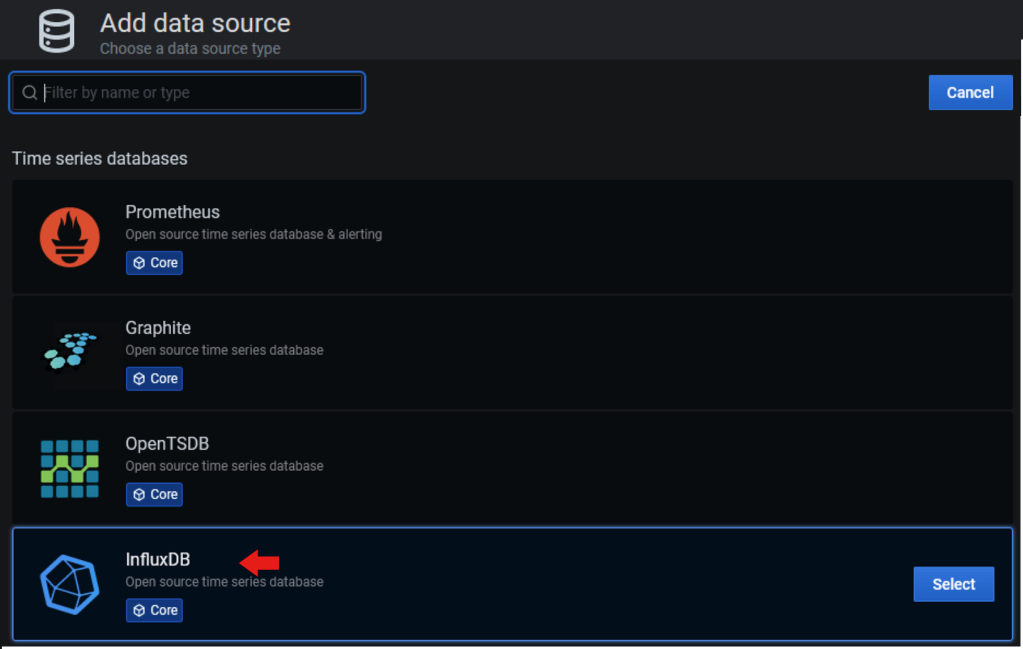
Specific settings for the InfluxDB database you set up earlier.
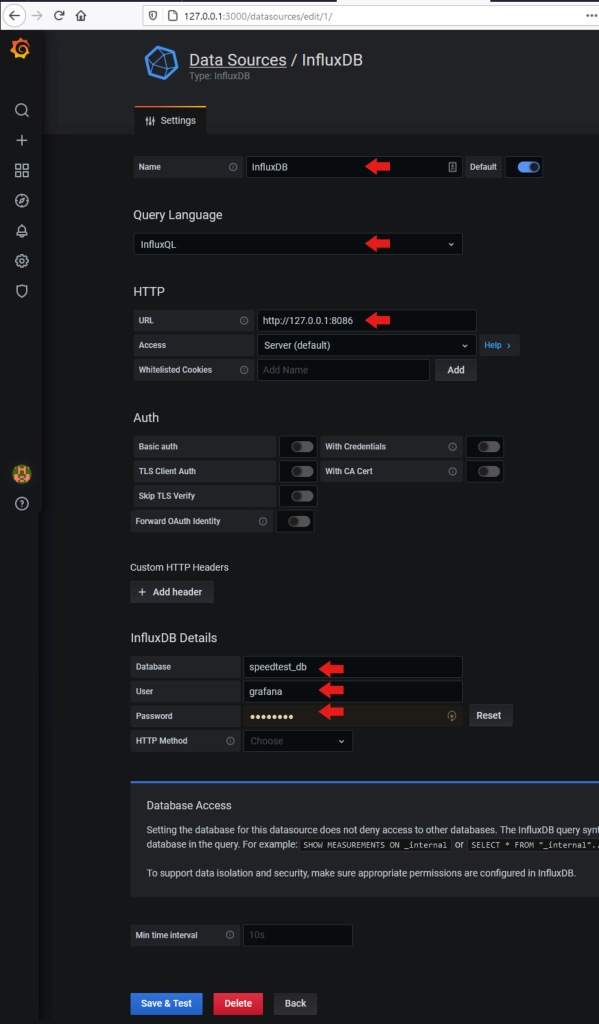
Click Save and Test.
You should receive a Data Source is Working message. If not, recheck that you provided the correct password for the InfluxDB that you set up earlier.Now you are going to import the Grafana desktop you downloaded earlier.
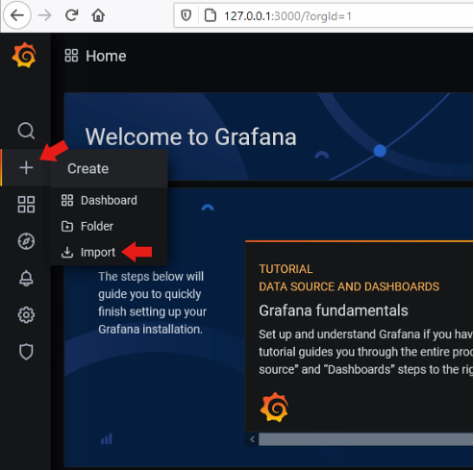
Click on the + sign and select Import.
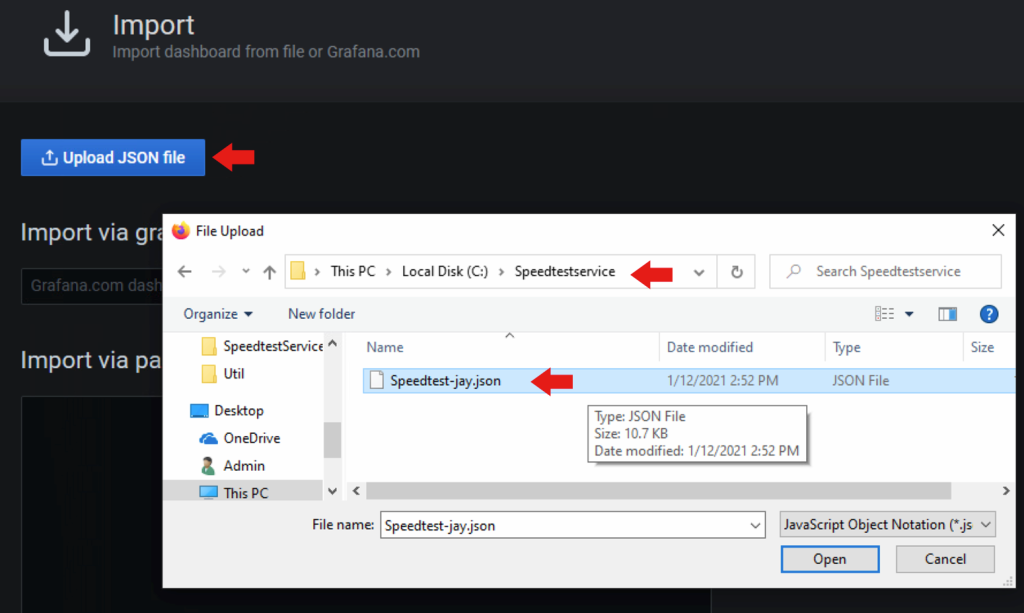
Select Import JSON and navigate to the C:\Speedtestserver directory. Select the Speedtest-jay.json file you downloaded earlier from my GitHub repository.
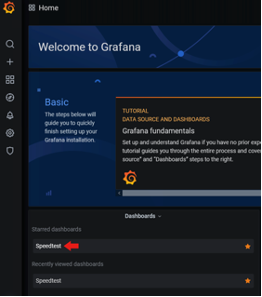
Back at the main Grafana screen, you can select the Speedtest dashboard.
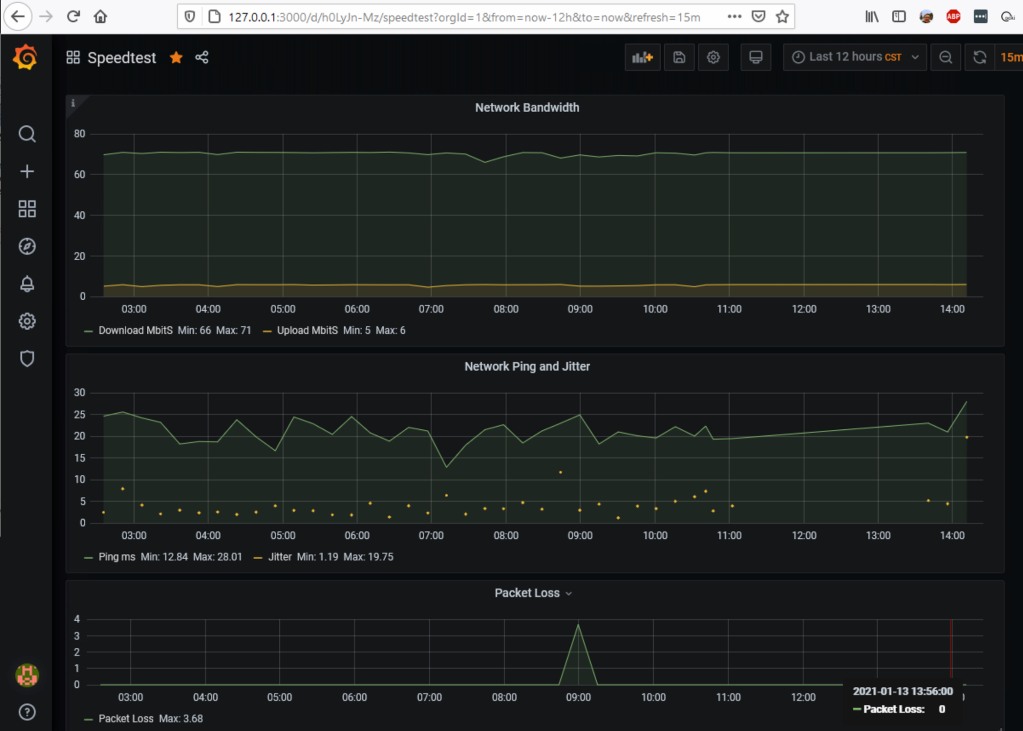
You should now see the Speedtest graphical display.
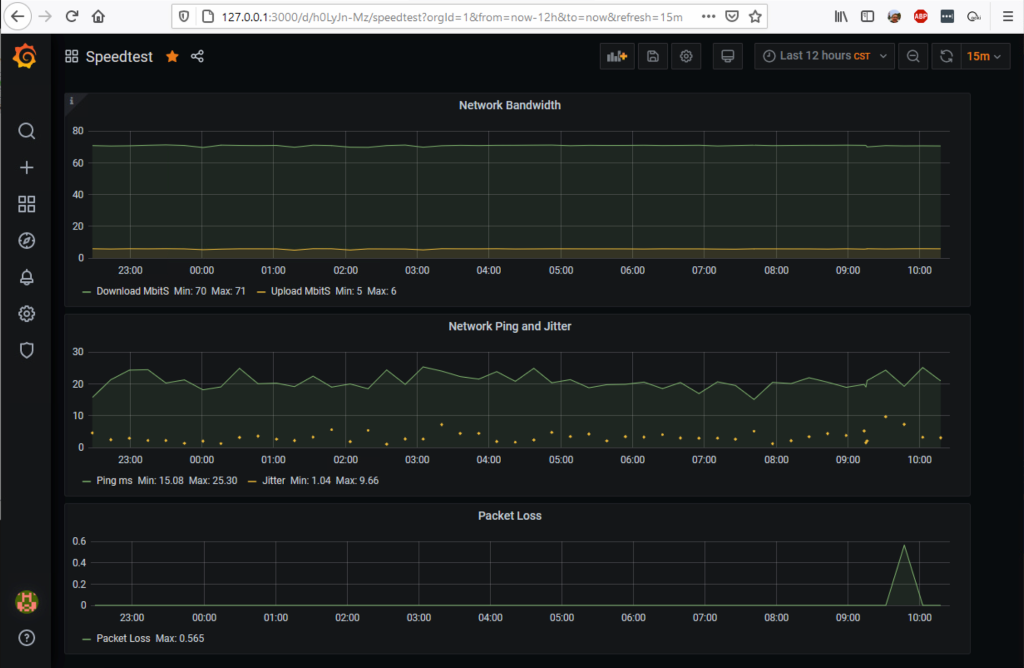
The top graph shows download and upload speeds, the middle graph shows ping time and jitter. I left the jitter values (yellow dots) as individual values to help me visualize when the data point was gathered. The bottom chart shows Packet Loss.
Conclusion
Speedy internet connections have become essential in today’s world. This project gave me a way to keep an eye on my network speed and familiarize myself with using some popular open-source tools on Windows 10.
Once again, I would like to thank Aiden Gilmartin, Simon Hearn, and all the others who contributed to the information I used to pull this together.

Thanks for the post. We are struggling with setting up InfluxDB as a system service. First thing we have noticed is that the Parameter string is missing a leading -config plus the PATH to the conf file. Still the service does not start. No debug information available in the syslog.
Hi, great post with very detial instructions! One minor error in instructions. When setting up nssm to run InfluxDb as service, in the Arguments section you should put: –config “influxdb.conf with full path”